Cassandra Bayer
Data Scientist

Clothing Purchases
This project does a deep dive of customers usage of an online retailer and responsiveness to an email campaign. The project also does a small design for an A/B to measure the efficacy of the campaign.
View Project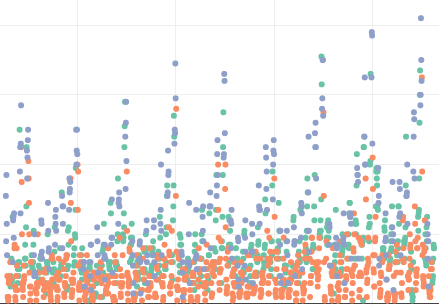
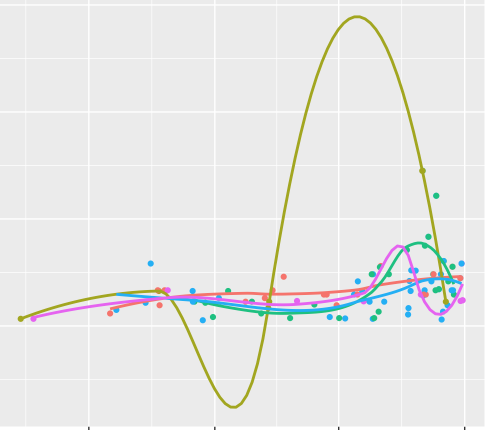
Ridership in NYC
This project analyzes patterns of drivers and riders for a rideshare in NYC overtime. The analysis includes possible explanations for deviations and patterns, and seeks to find time-based patterns for rideship during 2017.
View Project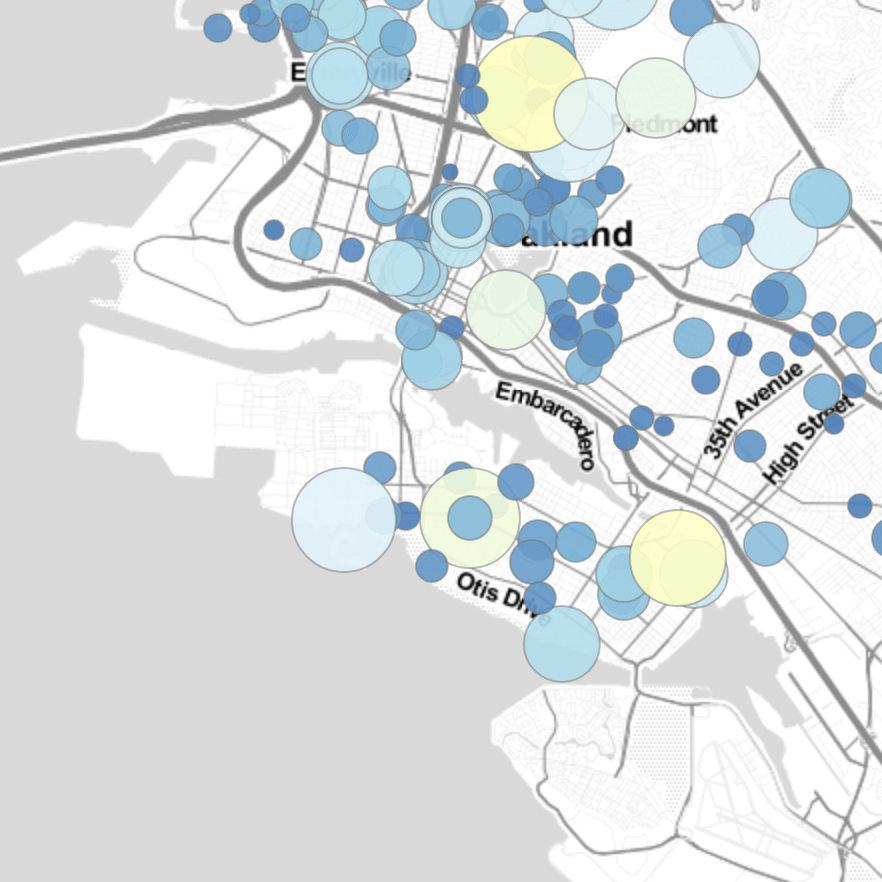
Cost of the Commute
I created interactive web map that shows the aggressive trade off between affordable housing and commute times in the Bay area; the map is available here. The project relied on heavily on Python and R for data cleaning, analysis, science and visualization. A more detailed account of the workflow, methodology, and findings can be accessed below.
View Project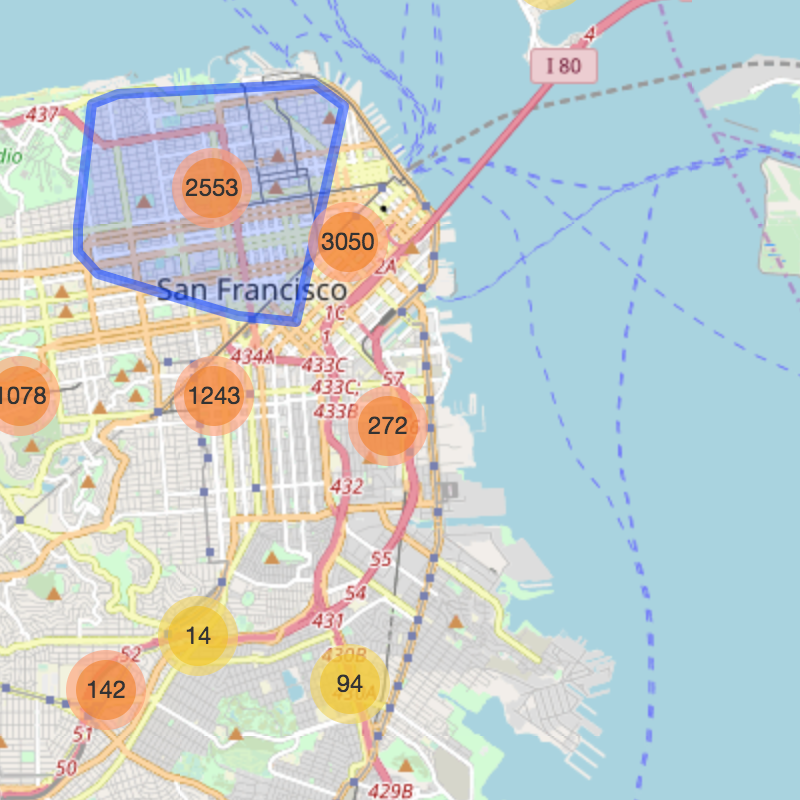
Affordable Housing Standards
This map here shows all Craigslist listings in green that are valued at the U.S. Department of Housing's "Fair Market Rate", or what housing should cost to be affordable. To perform the analysis, I gathered, cleaned, and analyzed two sets of primary data: Craigslist rental listings and ACS data accessed through American FactFinder.
View Project
Predicting Chronic Illness
The goal of the Flaredown work has been two-fold: we want to understand what causes "flare-ups", or upsets in a chronic illness patient's condition, and b) how to predict when a flare is coming. So far, we have cleaned the data and set up a pipeline and structure. We have created a controller to process the data and ease analysis. As a first model, we have created a quick reference for interactions of certain "trackables", or things a user tracks, against their general sense of well-being.
View Project
Modeling Household Income
I created a number of models using U.S. Census data to try to classify which households were low income. I used a number of binary classifiers including logit regression, SVM, and a decision tree. I found that the SVM had the most predictive capacity in terms of classification, but was also subject to noise. The regression, however, revealed that race and marital status bore heavily on one's probably of being low-income.
View Project